Comformational sampling of a small peptide
The potassium channel is a tetrameric transmembrane protein that selectivly conducts
potassium ions. The potassium ions permeate through a narrow pore composed of the highly
conserved TVGYG sequence, the so called signature sequence. This narrow pore is
highly selective to potassium ions and is called the selectivity filter.
The figure below shows two subunits of the selectivity filter on the left panel.
The carbonyls of the protein backbone are labeled by the corresponding residue of the
signature sequence.
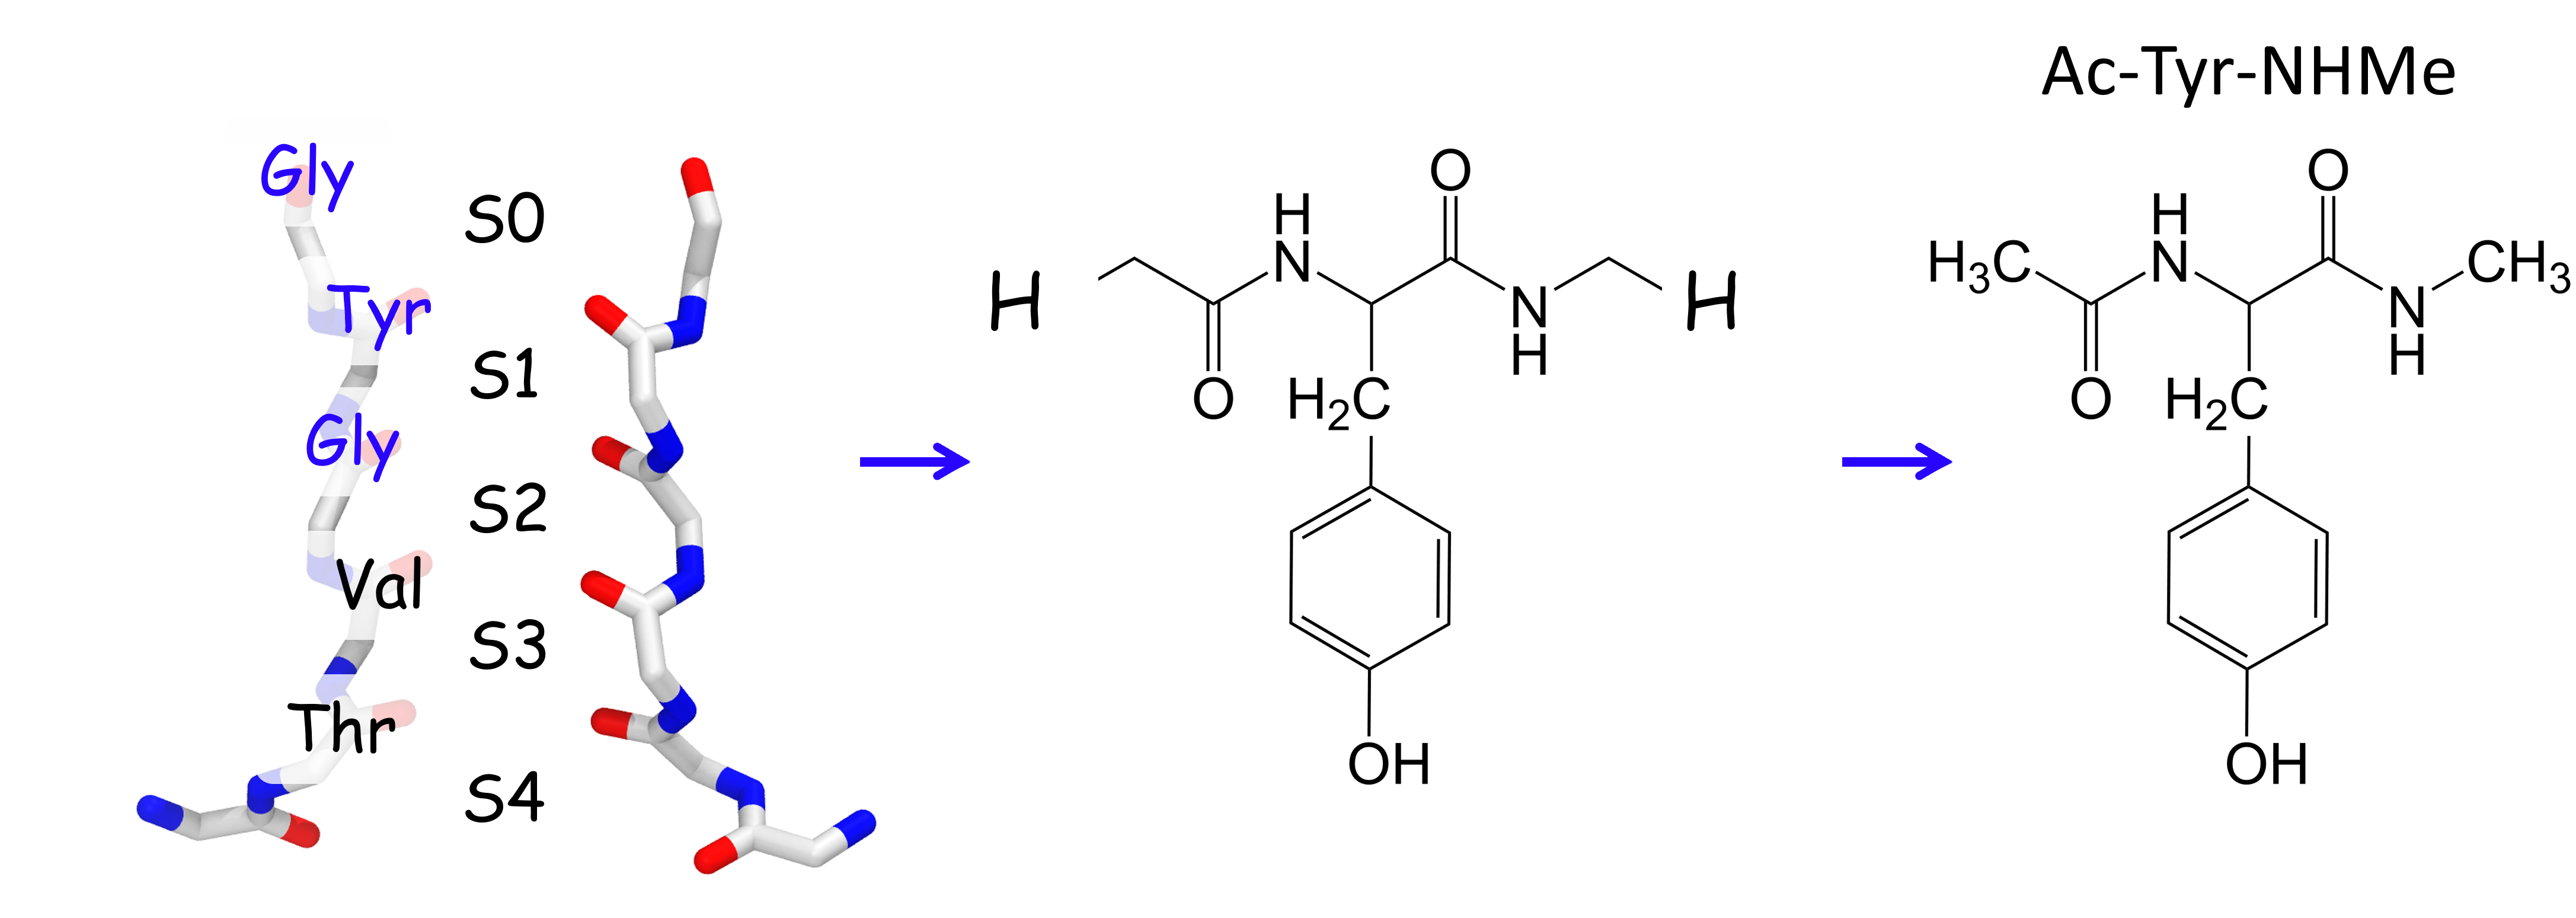
Here I describe the conformational sampling of the Ac-Tyr-NHMe peptide with Temperature Replica Exchange MD simulations (TREMD). This peptide is a model of the GYG portion of the selectivity filter, the blue colored residue labels on the left and pictured in the middel of the figure above. The GYG peptide, which is shown on the right panel of the figure above, was studied by Ishiuchi et al. with infrared laser spectroscopy and ab initio calculations.
The TREMD is implemented in the standard way through the multiple-copy scripting interface in NAMD. Furthermore, the Theoretical and Computational Biophysics Group in the University of Illinois at Urbana-Champaign has a wonderful introduction to replica exchange. A total of 12 replicas/copies were used ranging from 80-300 K in 20 K increments. Each replica can only exchange with its next neighbor. The replica neighbors for the algorithm are assigned like so
"""
To implement the replica neighbors we look at the current replica id, r,
then we record the current replica's i+1 and i-1 neighbor in an array
and take into account that the first and last replicas only have one
neighbor
"""
if { $r % 2 == 0 && $r+1 < $nr } {
    set replica(loc.a) [expr $r+1]
    set replica(index.a) [expr $r+1]
}
if { $r % 2 == 1 && $r > 0 } {
   set replica(loc.a) [expr $r-1]
   set replica(index.a) [expr $r-1]
}

if { $r % 2 == 1 && $r+1 < $nr } {
   set replica(loc.b) [expr $r+1]
   set replica(index.b) [expr $r+1]
}
if { $r % 2 == 0 && $r > 0 } {
   set replica(loc.b) [expr $r-1]
   set replica(index.b) [expr $r-1]
}

"""
This allows one to track the temperature of the current replica.
We can either exchange temperatures or coordinates and exchanges are based
on the standard acceptance criterion.
"""
A good indicator of the sampling quality in a replica exchange simulation is the acceptance ratio of the exchange attempts. In this case, the acceptance ratios range from 0.3 to 0.7, which suggests that the sampling is adequate and no additional temperatures are needed.
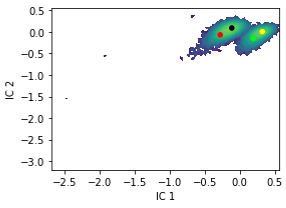
We can use PyEMMA, a Python library, to analyze the MD trajectory of the GYG protein after conformational sampling. PyEMMA has functions to featurize, reduce, cluster, and visualize the data. We can then cluster the trajectory frames to find the sampled poses of the protein. This can be done like so:
First, we featurize the trajectory with the distance between the O-O, O-K, O-OH, and K-OH, which correspond to the atom distances between the carbonyl, ion, and sidechain. PyEMMA also offers other features that can be found here. This is how the featurization is implemented:
# Create instance of the featurizer from mdtraj topology object
feat = pm.coordinates.featurizer(traj.topology)

# add the distances to the featurizer
feat.add_distances(indices)

# then you can view the added features with
print(feat.describe())

# apply the featurization to the trajectory
distances = pm.coordinates.load(traj_file, features=feat)

# if done correctly the following will be of shape
# (Number of frames in traj, Number of features in featurizer)
print("The shape of the feature data: ", distances.shape)
Second, we tranform the data with time-lagged independent component analysis (TICA). This allows us to reduce the dimensionality of the featurization. For example, we can do it like this:
tica = pm.coordinates.tica(distances) # perform tica on feature spaceLastly, we cluster the TICA output with:
cluster = pm.coordinates.cluster_kmeans(tica, k=4, max_iter=90) # cluster in tica spaceThe TICA analysis reveals two distinct poses from the data.
We can use the clustering output to select frames from the trajectory
that correspond to these poses.
The figure below shows the two clusters obtained from the TICA output.
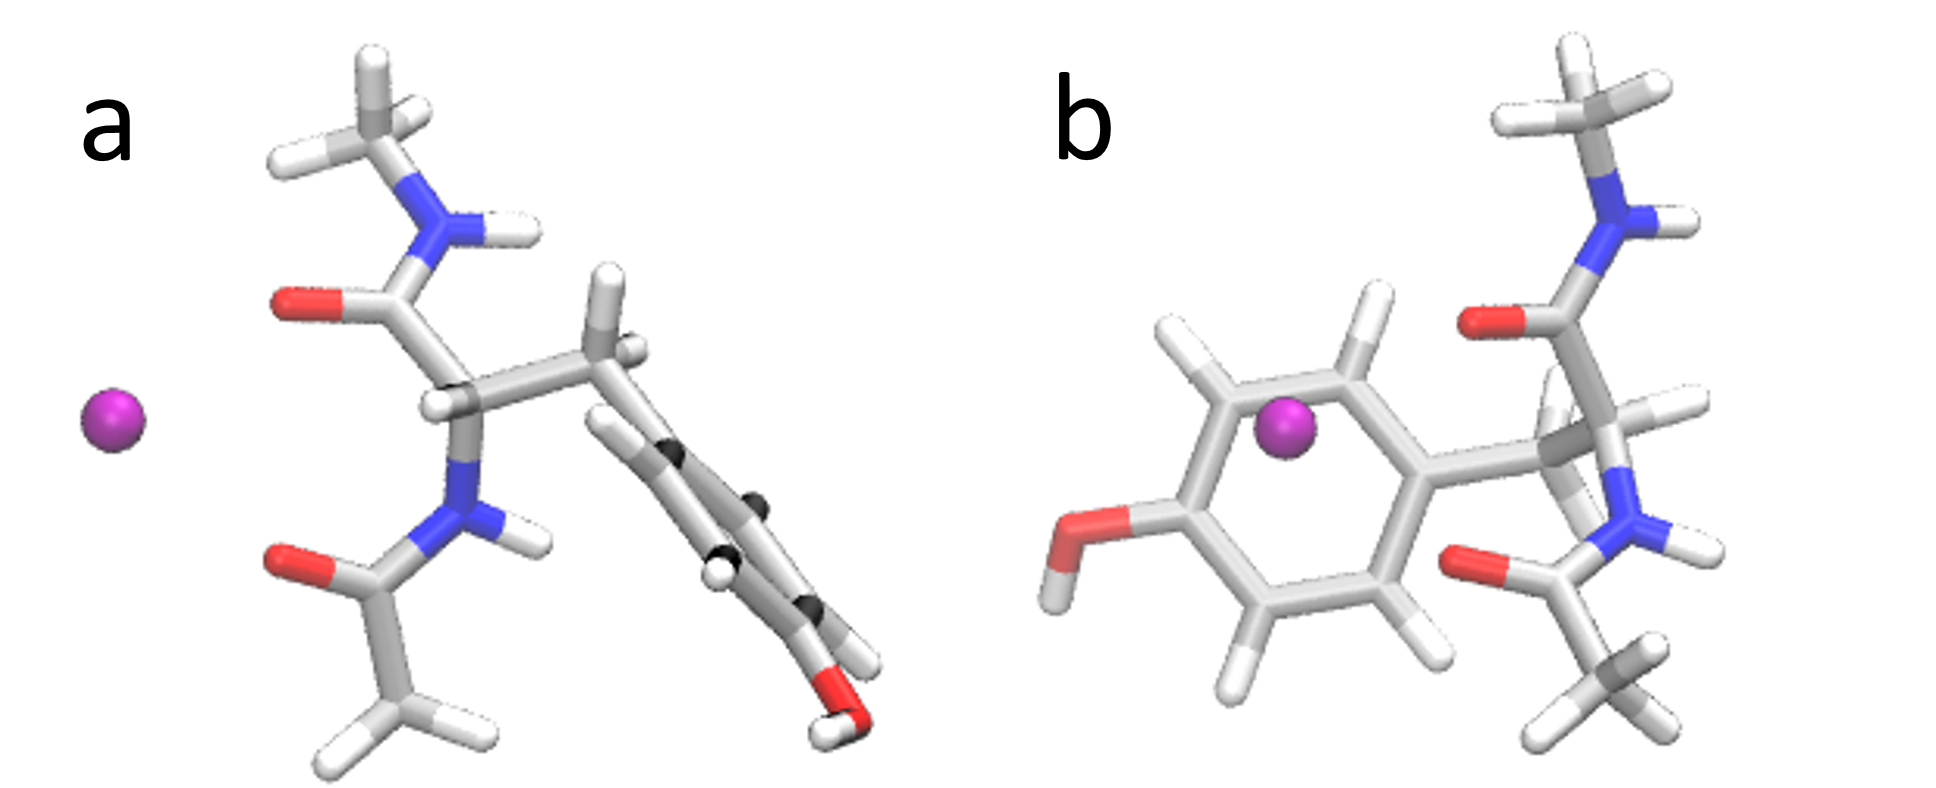
The final poses are shown below.
These are obtained by taking the average of four representative
frames for each cluster and energy minimizing.